Machine Learning for Design
Lecture 2
Introduction to Machine Learning. Part 2
The Machine Learning Life-Cycle
Cross-Industry Standard Process for Data Mining (CRISP-DM) methodology
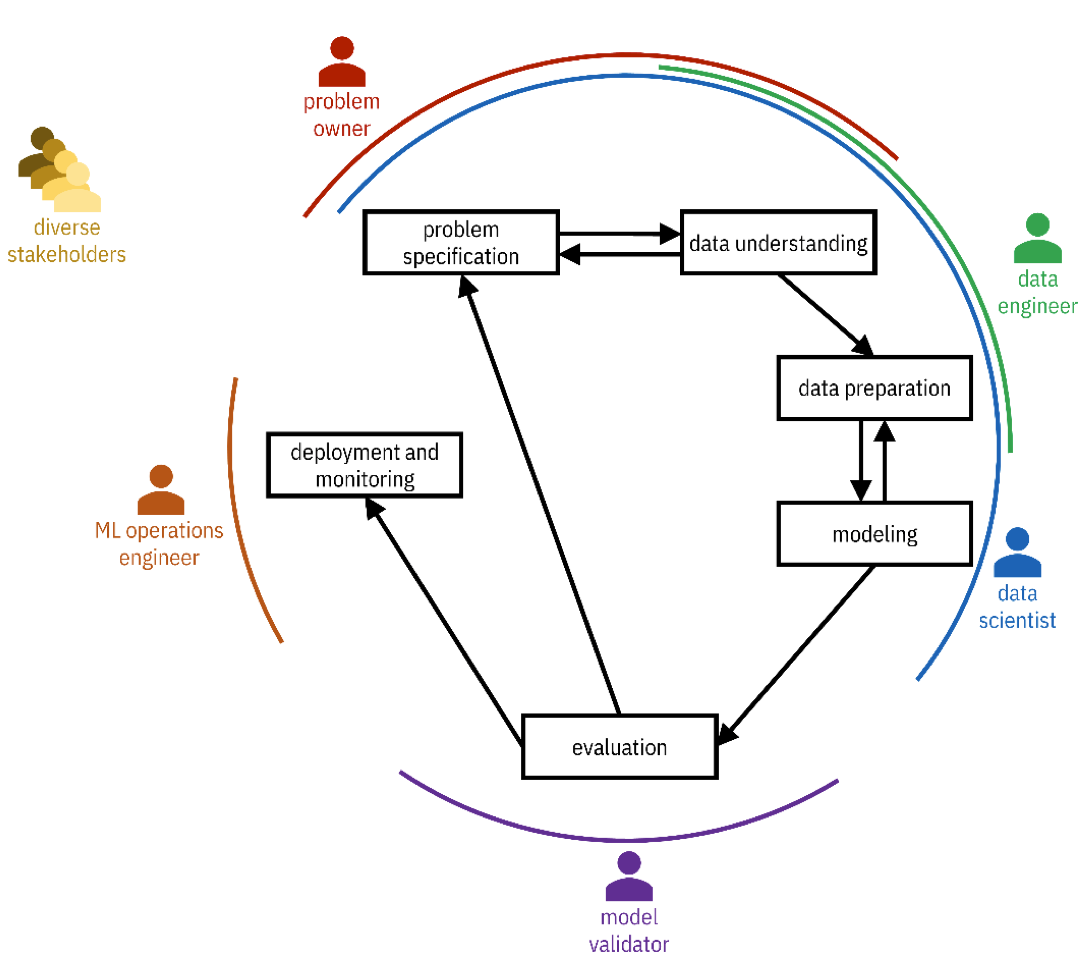
CRISP-DM In our course

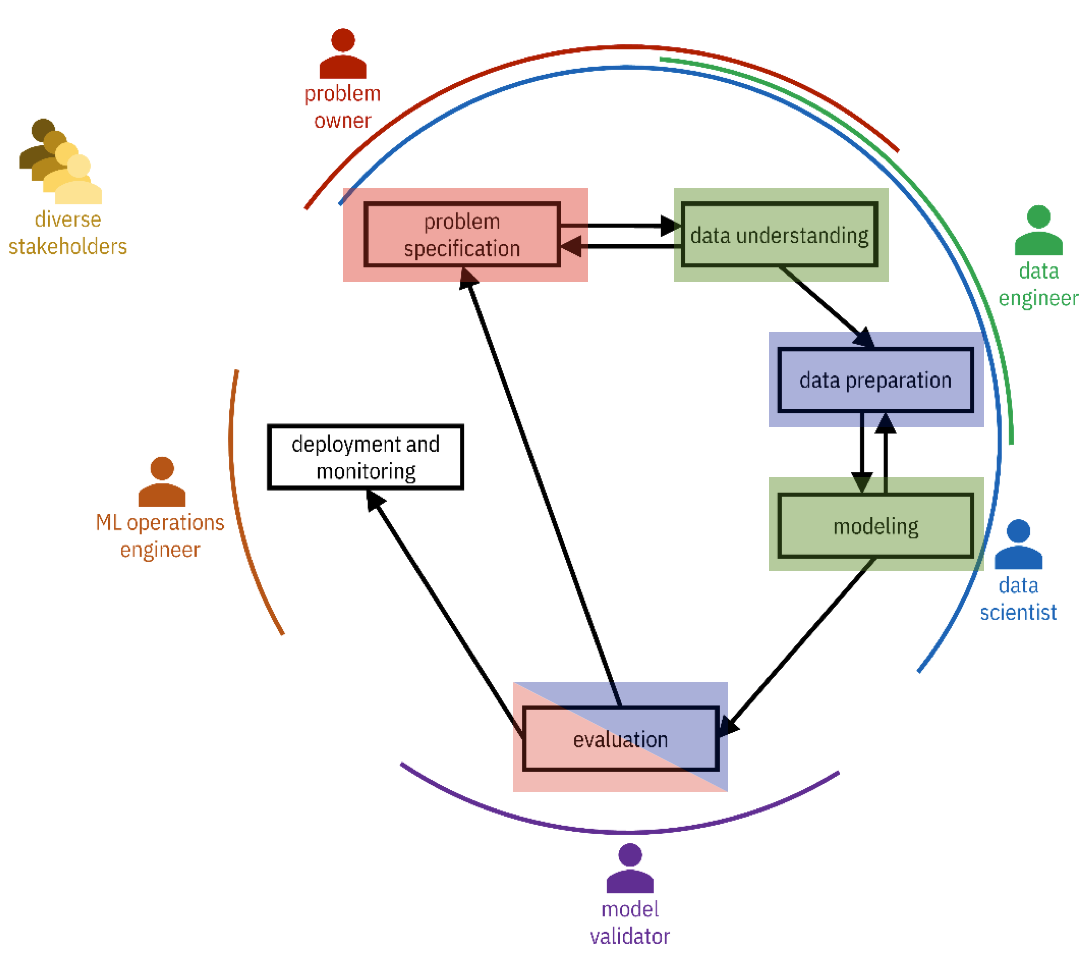
Problem Specification
What is the problem owner hoping to accomplish and why?
Why am I (being asked to) solve it?
Am I the right person to solve this problem?
What are the (psychological, societal, and environmental) repercussions of building this technology?
Should this thing be built at all?
What are the metrics of success?
Data Understanding
Know your data!
Data need to be collected —> Datasets
What data is available?
What data should be available, but isn’t?
What population / system / process is your data representing?
And what properties of such population / system / process are included (or excluded)?
What biases (social, population, temporal) are present in your datasets?
Data Preparation
- Data integration
- Extracting, transforming, and loading (ETL) data from disparate relevant databases and other data sources
- This step is most challenging when dealing with big data sources
- Data cleaning
- Filling missing values
- Transforming value types (e.g. binning)
- Dropping features that should not be considered
- Feature engineering
- Transform the data to derive new features
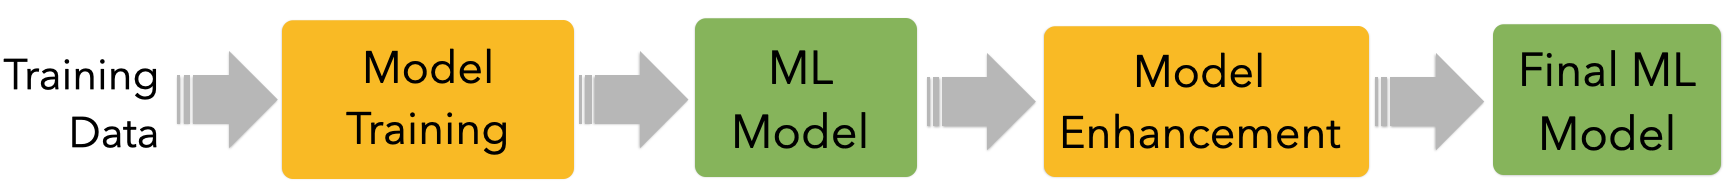
Modeling
- Select a training algorithm
- Use it to find patterns in the training dataset
- Generalize them to fit a statistical model
- Enhance the model to satisfy additional objectives and constraints captured in the problem specification
- e.g., increase reliability, mitigate biases, generate explanations
- No free-lunch theorem
- There is no one best machine learning algorithm for all problems and datasets
Evaluation
- Testing and validation of the model
- Also against the problem specification requirements
- Performed on data not used for training
Hold out dataset
Model auditing/risk management

Deployment and monitoring
- What data infrastructure will bring new data to the model?
- Will predictions be made in batch or one-by-one?
- How much latency is allowed?
- How will the user interact with the system?
- Is there a problem here?
- Tools to monitor the model’s performance
- And ensure it is operating as expected
Data
The raw material
Data
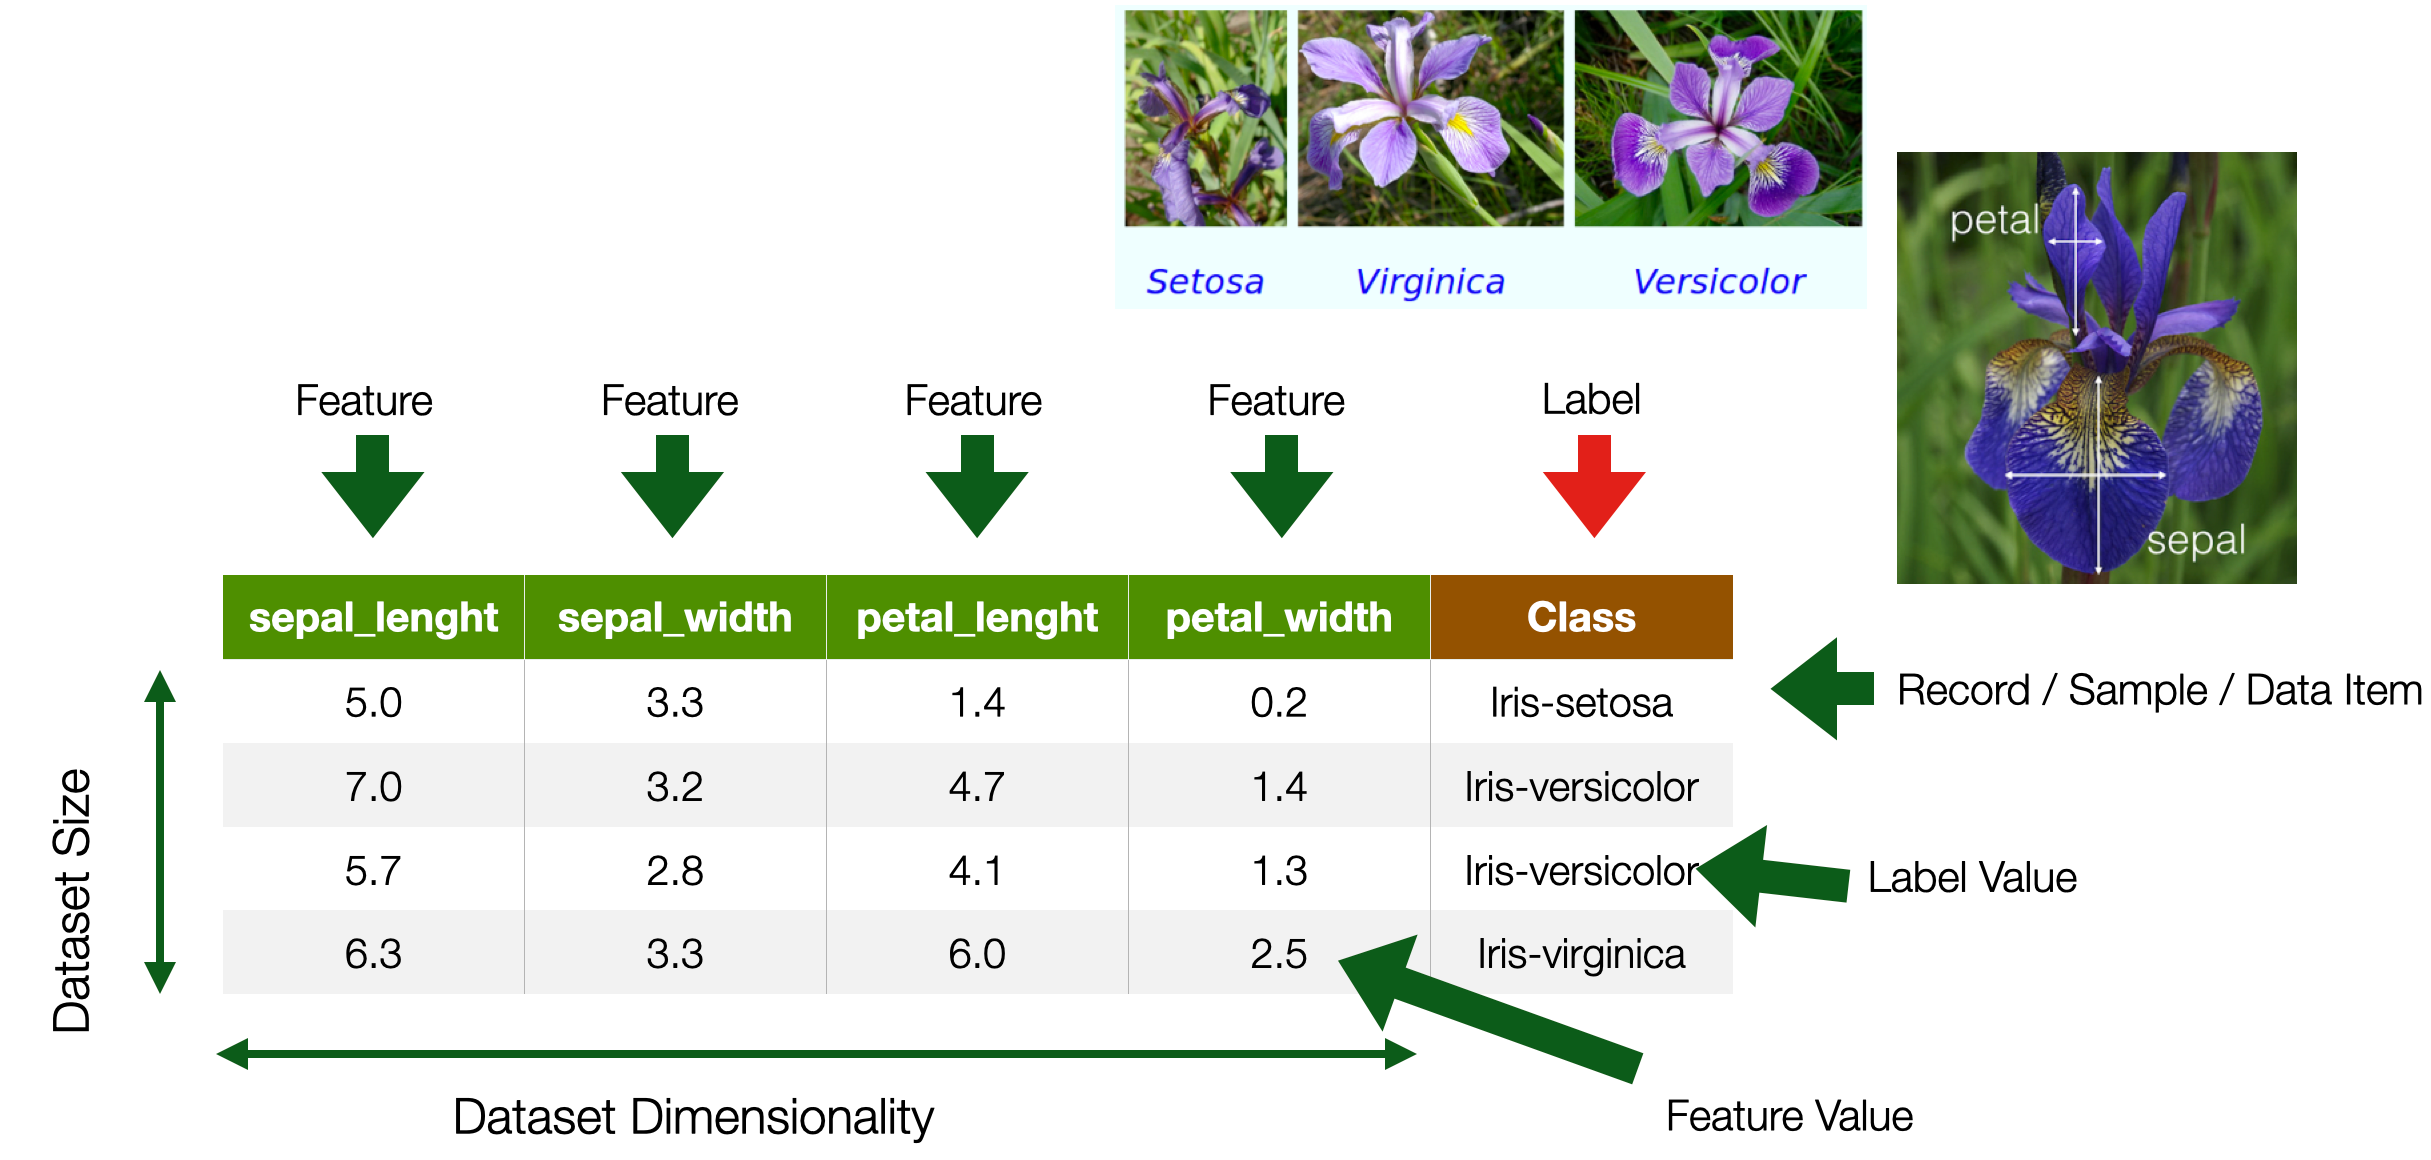
Types of Features / Label Values
- Categorical
- Named Data
- Can take numerical values, but no mathematical meaning
- Numerical
- -Measurements
- Take numerical values (discrete or continuous)
Categorical Nominal
- No order
- No direction
- e.g. marital status, gender, ethnicity
Categorical Ordinal
- Order
- Direction
- e.g., letter grades (A,B,C,D), ratings (dislike, neutral, like)
Numerical Interval
- Difference between measurements
- No true zero or fixed beginning
- e.g., temperature (C or F), IQ, time, dates
Numerical Ratio
- Difference between measurements
- True zero exists
- e.g., temperature (K), age, height
Data Modalities
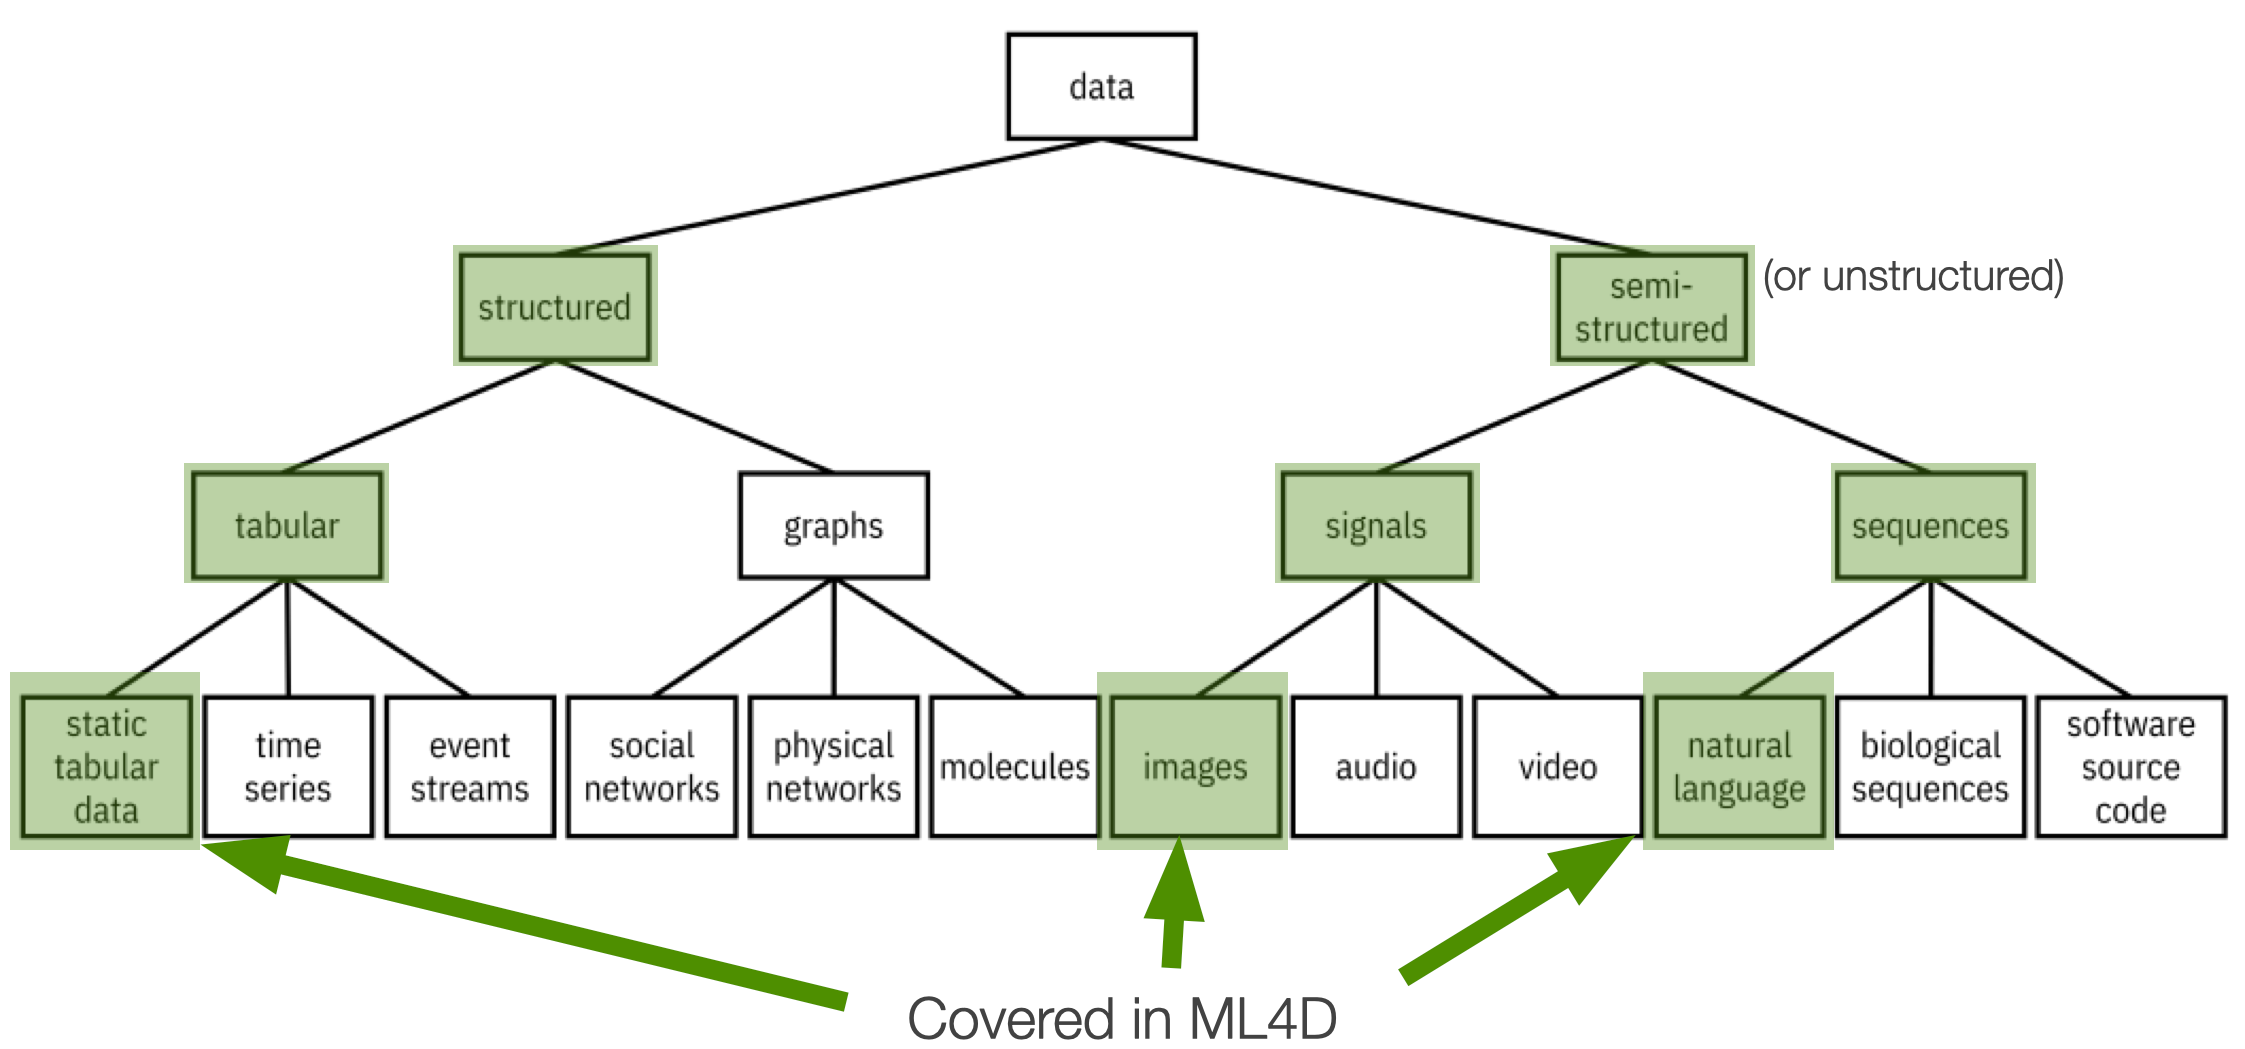
Key Dimensions
| Modality | Quantity | Quality | Freshness | Cost |
|---|---|---|---|---|
| Structured | Number of records | Errors | Rate of collection | Acquisition |
| Semi-structured | Number of features | Missing data | Licensing | |
| Bias | Cleaning and integrations |
Static Tabular Data
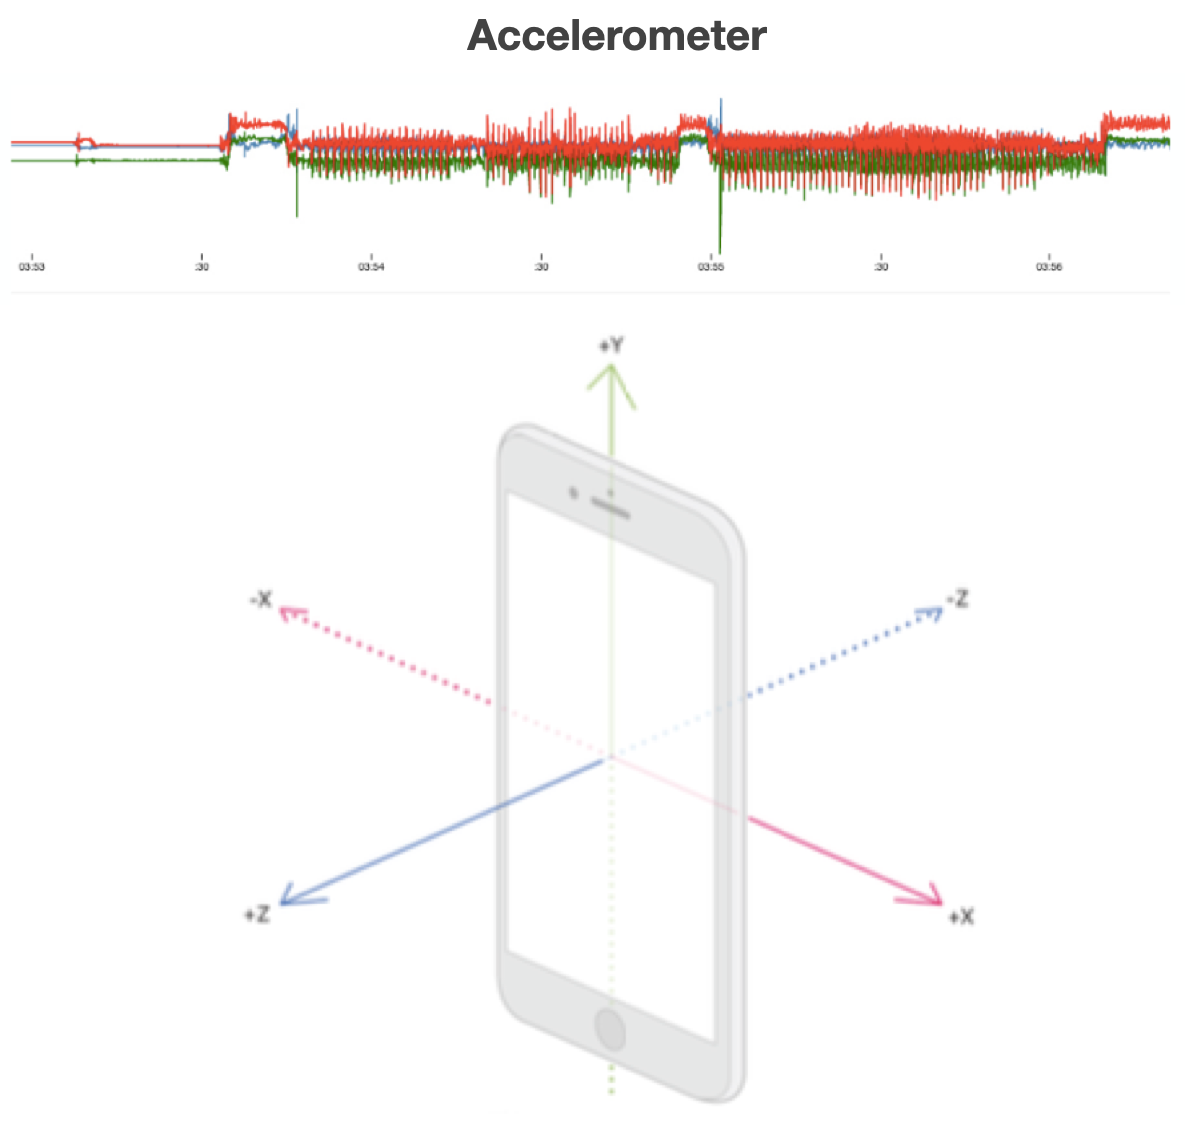
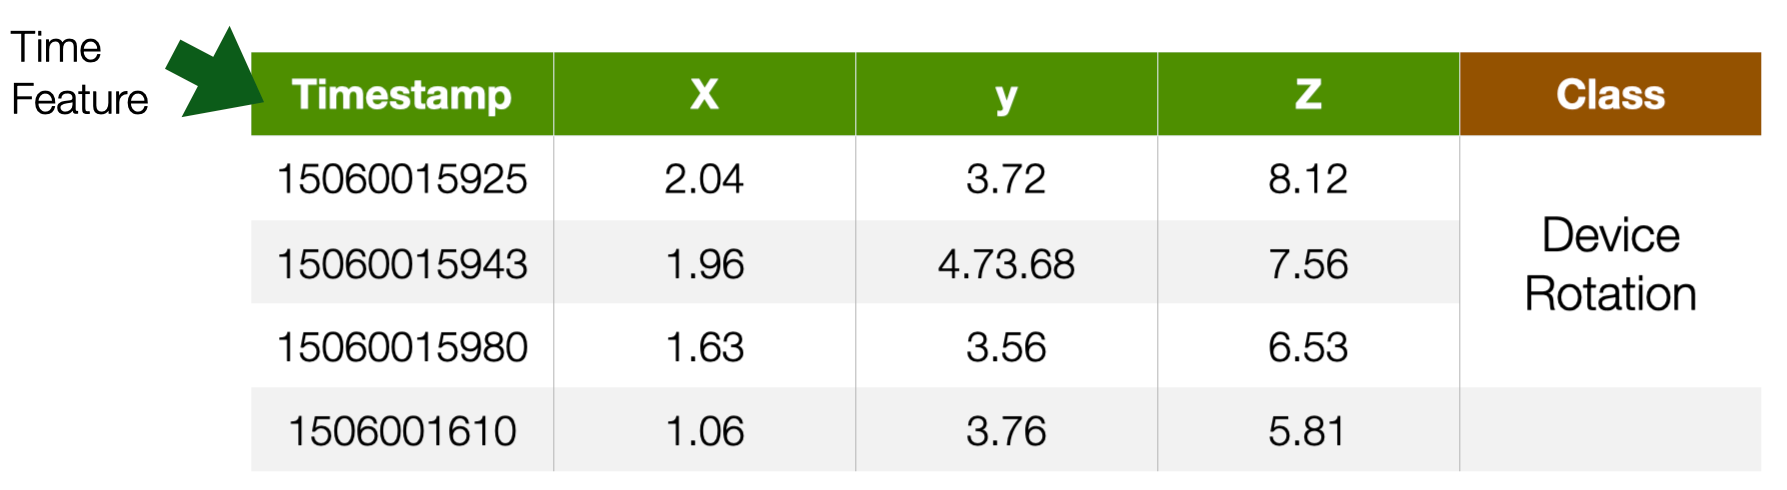
Time Series
- tabular data with time feature
- For instance
- Sensor data, Stock market data
- Label is usually associated with a set of records
- e.g. a continuous movement of the phone indicating an action
Images
- Visual content acquired through cameras, scanners, etc.
- Each pixel in an image is a feature
- But spatially and geometrically organised
- e.g., edges, corners
- Feature values are numerical values across channels
- e.g., R,G,B
- Dimensionality --> n x m
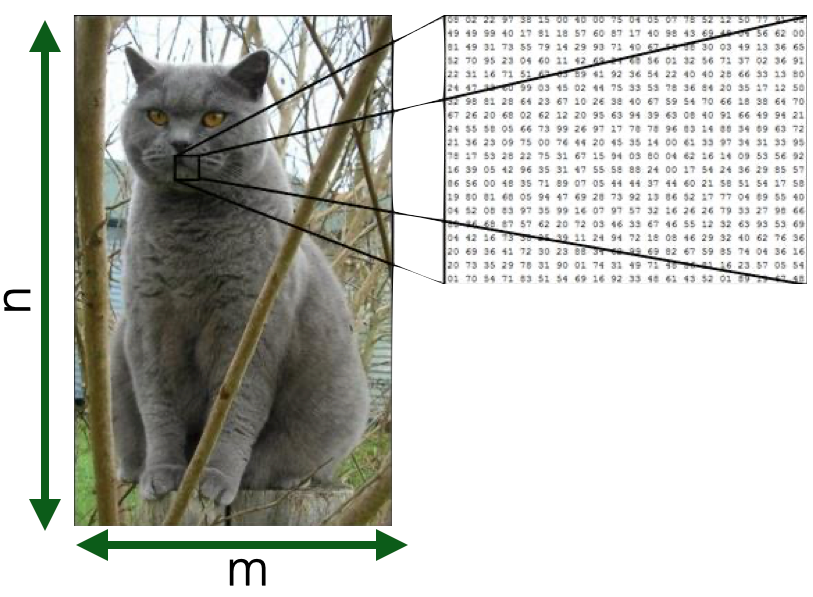
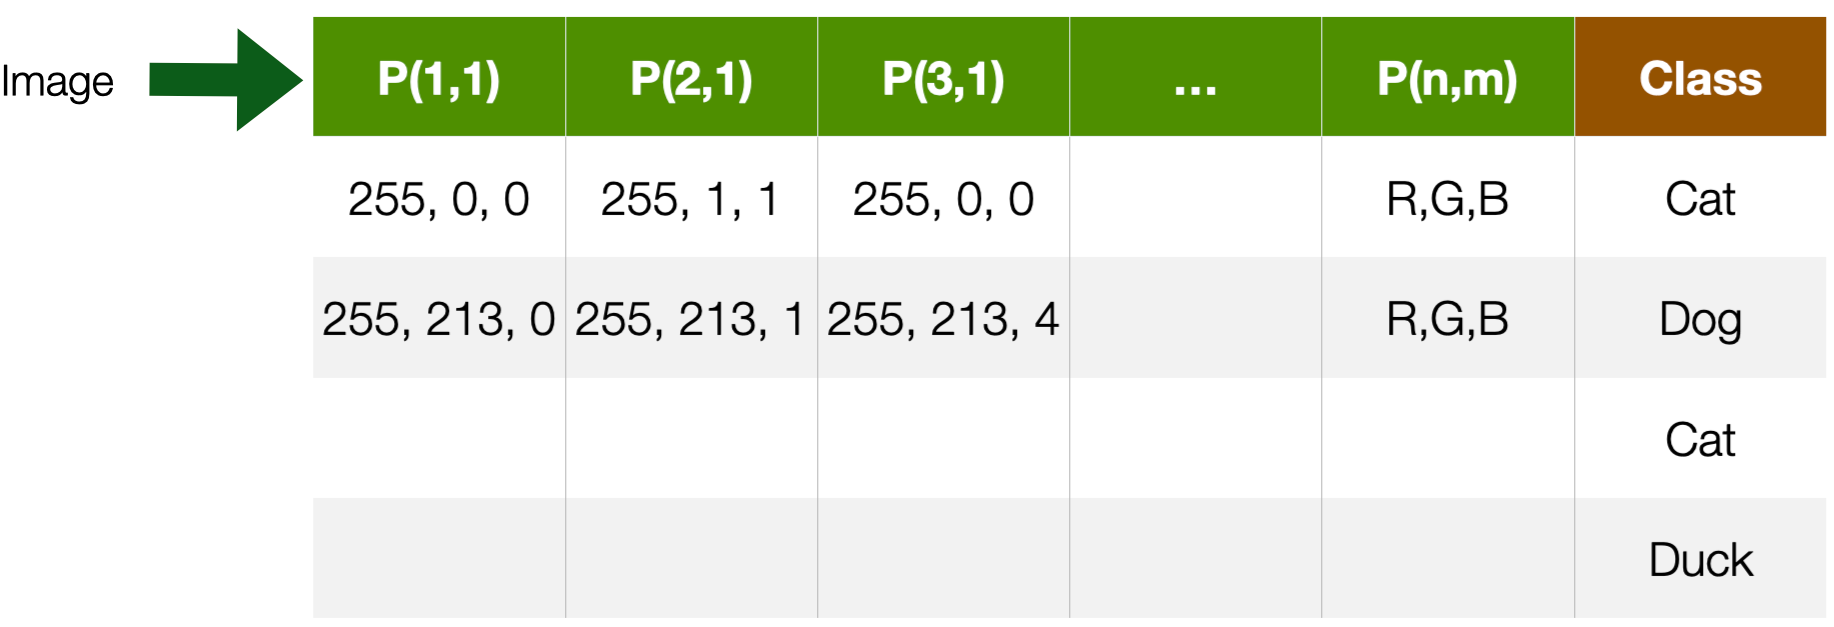
More in Module 1
Textual documents
- Sequence of alphanumerical characters
- Short: e.g. tweets
- Long: e.g Web documents, interview transcripts
- Features are (set of) words
- Words are also syntactically and semantically organised
- Feature values are (set of) words occurences
- Dimensionality --> at least dictionary size

More in Module 2
Data Sources
| Purposefully Collected Data | Administrative Data | Social Data | Crowdsourcing |
|---|---|---|---|
| Survey | Call records | Web pages | Distributed sensing |
| Census | Financial transactions | Social Media | Implicit crowd work (e.g. captcha) |
| Economic Indicators | Travel Data | Apps | Micro-work platforms (e.g Amazon Mechanical Turk) |
| Ad-hoc sensing | GPS Data | Search Engines |
Data Sources
| Purposefully Collected Data | Administrative Data | Social Data | Crowdsourcing |
|---|---|---|---|
| Modality: mostly structured | Modality: mostly structured | Modality: mostly semi-structured | Modality: all |
| Quantity: low | Quantity: high | Quantity: low | Quantity: mid-low |
| Quality: high | Quality: high | Quality: low | Quality: mid |
| Freshness: low | Freshness: high | Freshness: high | Freshness: mid |
| Cost: high | Cost: high | Cost: low | Cost: mid-low |
Categories of Machine Learning
How do machines learn?
On Models
A physical, mathematical, logical, or conceptual representation of a system, entity, phenomenon, or process
- A simple(r) representation of reality helping us understand how something works or will work.
- Not truthful, just a useful one
- The goal of models is to make a particular part or feature of the world more accessible to understand, define, quantify, visualise, or simulate
Examples of models
Architecture plans
Maps
Music Sheet
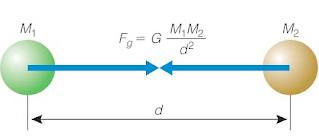
Mathematical laws of physics!
Machine Learning (statistical) Models

Scientific Models
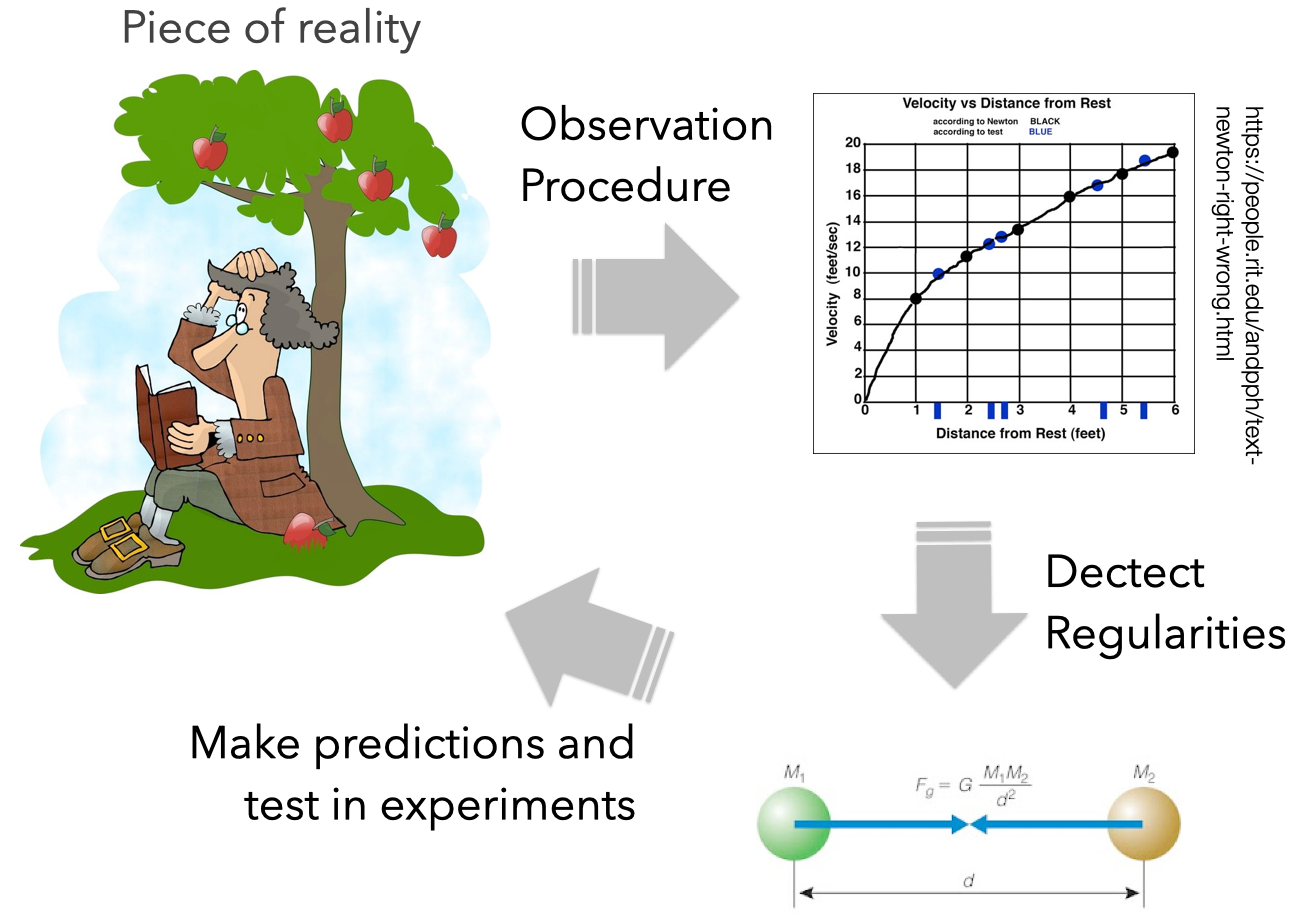
- GOAL: explain reality
- Created to make predictions about the outcomes of future experiments
- e.g., apples on the moon
- Tested against the outcome
- If data from new experiments don’t agree, the model has to be modified/extended / refined
- Falsifiability
- Scientific models should be small and simple.
- They should generalize phenomena observed in new ways.
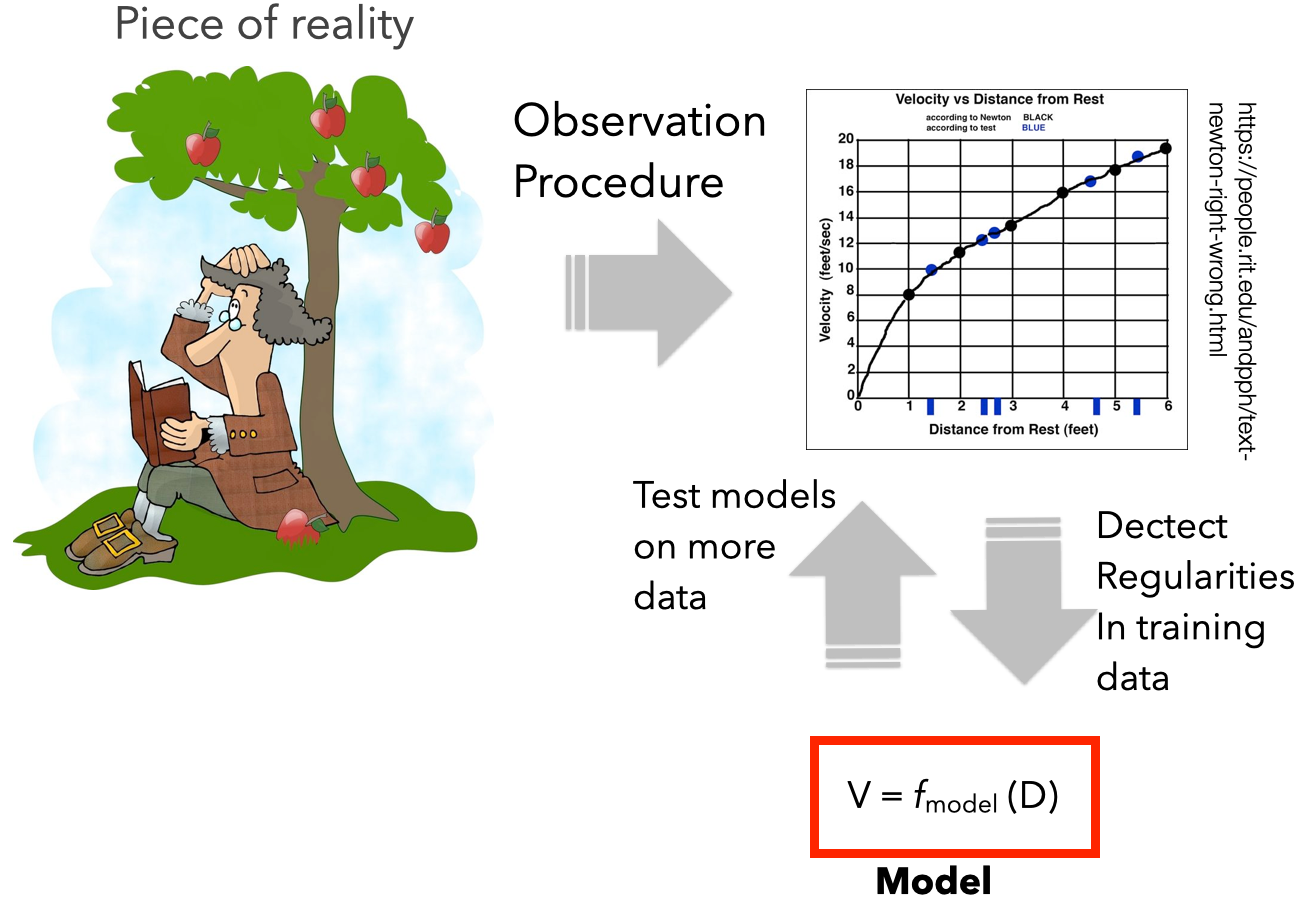
ML Models
- GOAL: describe the data
- Designed to capture the variability in observational data by exploiting regularities/symmetries/redundancies
- A good ML model doesn't need to explain reality, it just describe data
- They don’t need to be simple or transparent, or intelligible. Just accurate
- Black box
- ML models may be large and complex.
- They should generalize to new data obtained in the same way as the training data
- Same application context and data acquisition process

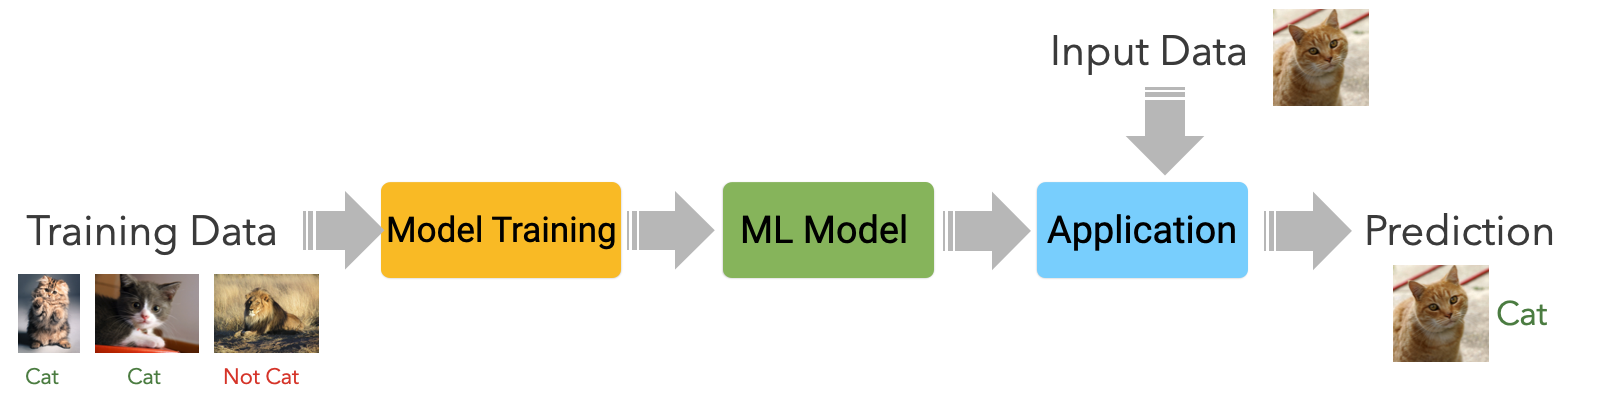
Supervised Learning
- Input: labeled data
- Data + expected prediction
- During training, labels are used to associate patterns with outputs
- Learns how to make input-output predictions
- Classification
- Regression
- Ranking
- Recommendation
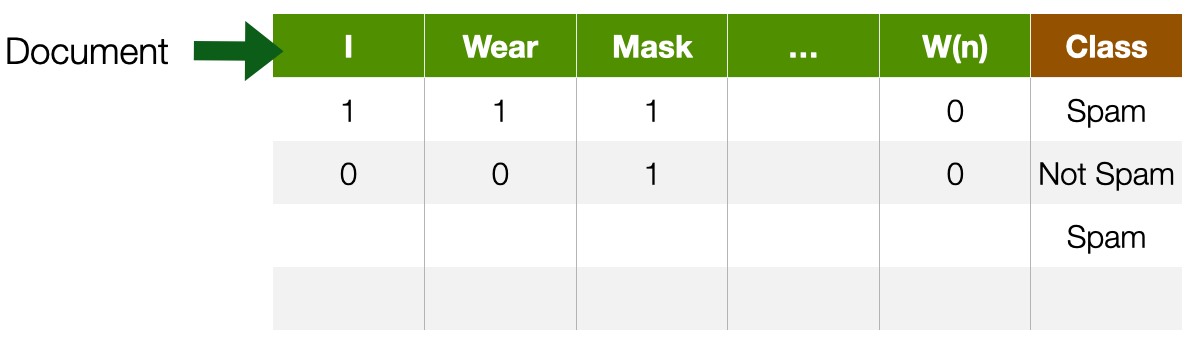
Classification
- Learn to output a category label
- Binary
- e.g. Spam / not Spam, Cat / not cat
- Multi-class
- e.g. cat, dog, bird
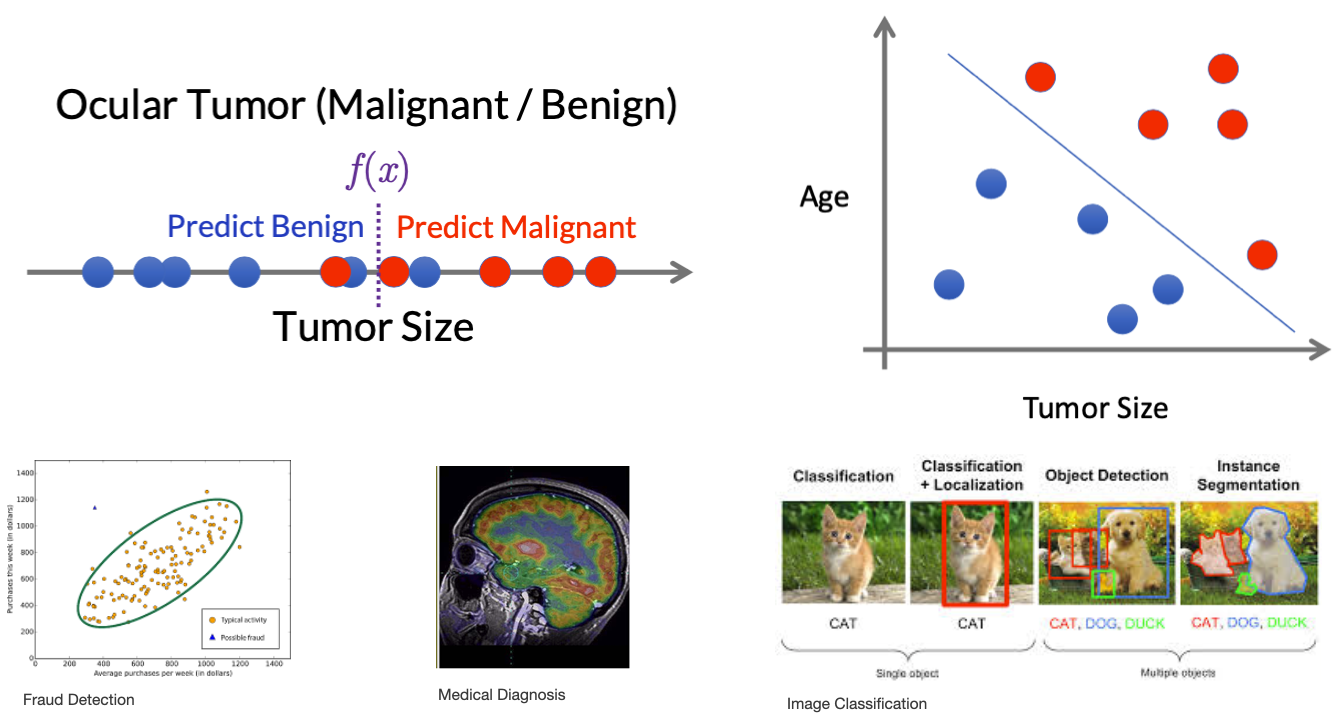
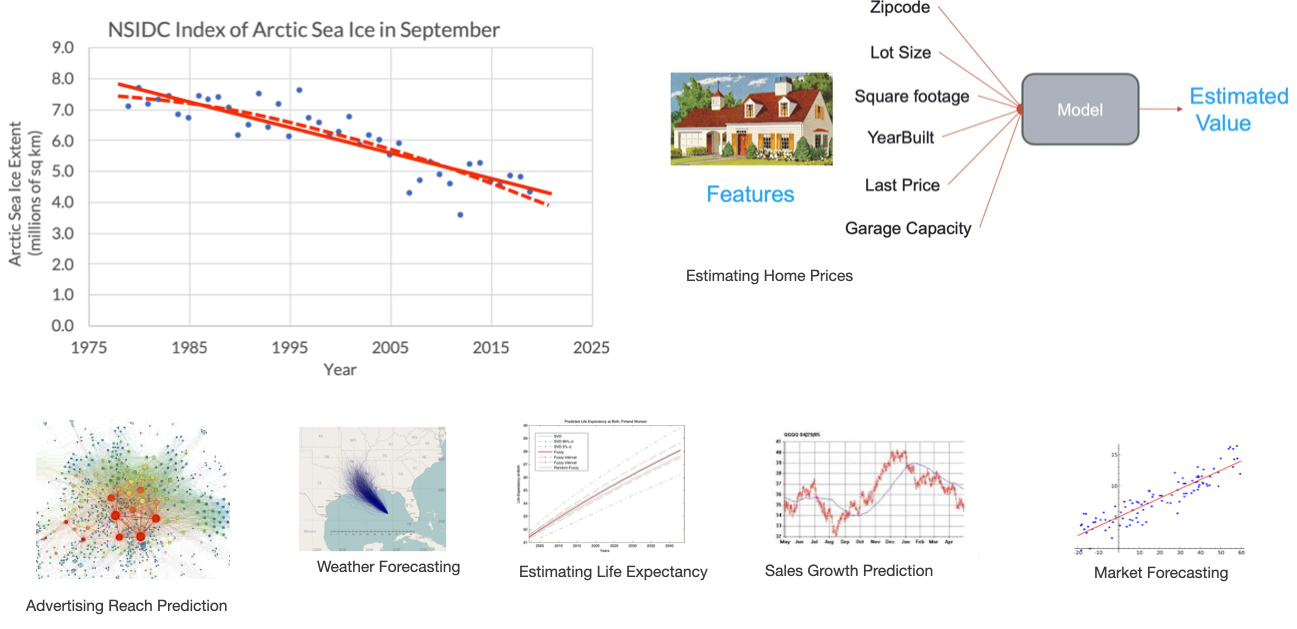
Regression
- Learn to output one or more numbers
- e.g., value of a share, number of stars in a review
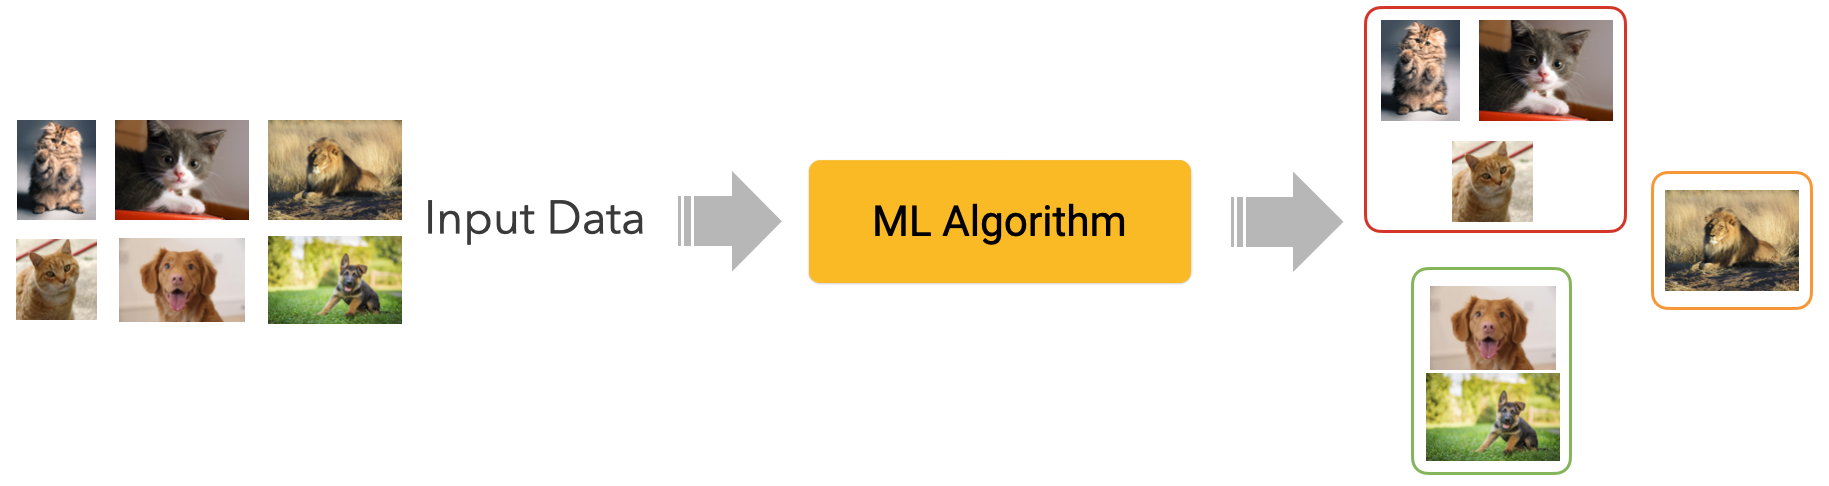
Unsupervised Learning
- Input: unlabeled data
- The machine learns structures (patterns) from the data without human guidance
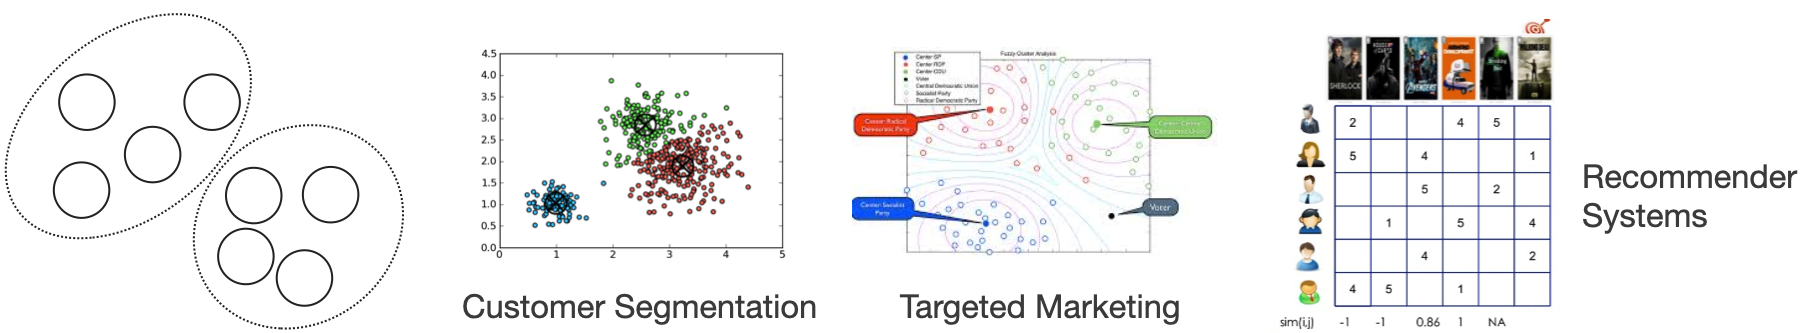
- Clustering
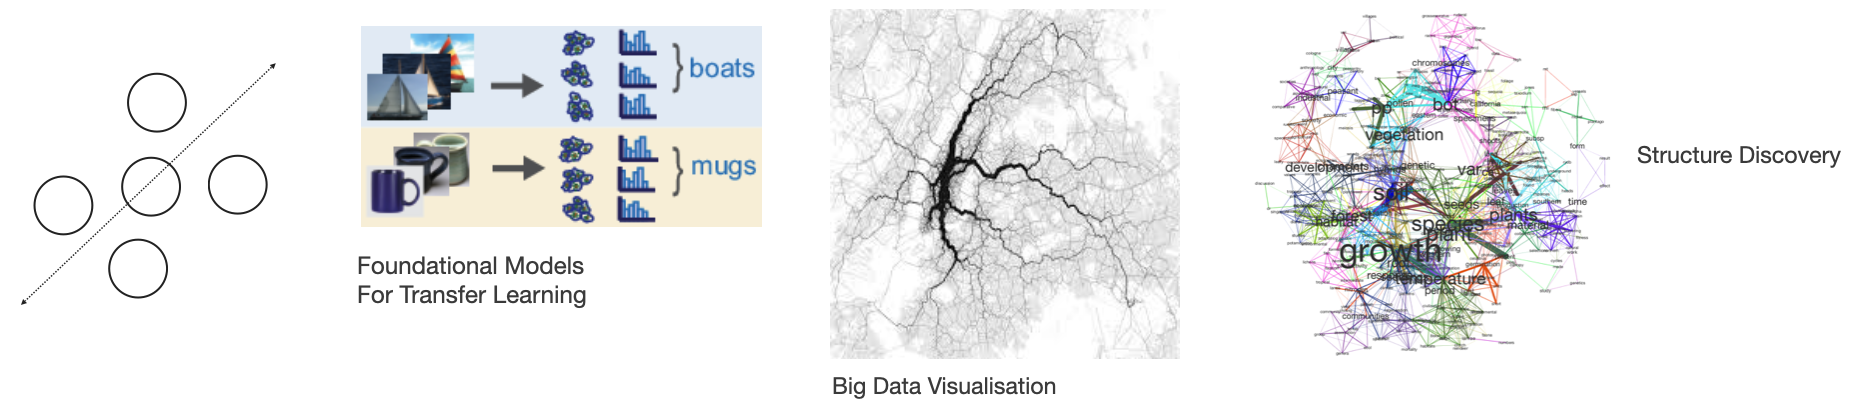
- Dimensionality Reduction (e.g. Large Language Models)
- Anomaly detection&
Clustering
Dimensionality Reduction
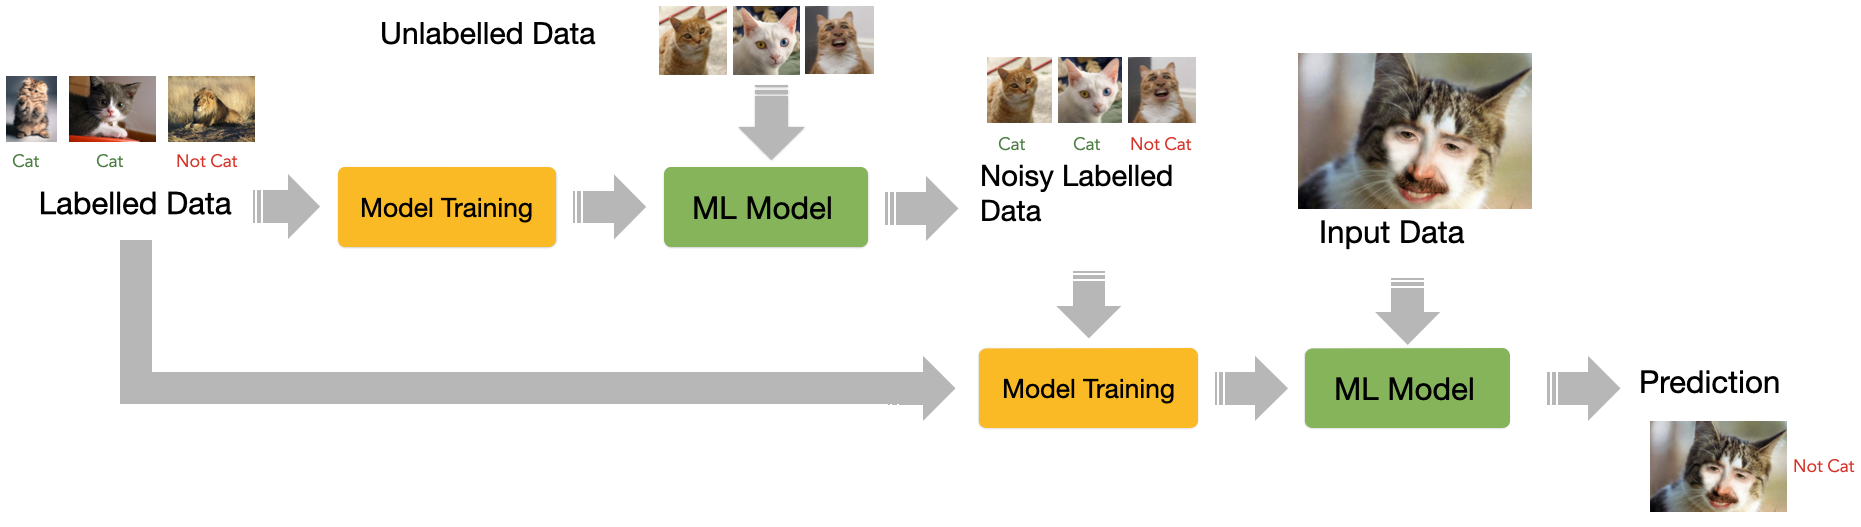
Semi-Supervised Learning
Combination of supervised and unsupervised learning
Few labeled data in the input are used to create noisy labeled data
With more labeled data, the machine learns how to make input-output predictions
Transfer Learning
Often called fine-tuning
Reuse a model trained for one task is re-purposed (tuned) on a different but related task
Useful in tasks lacking abundant data
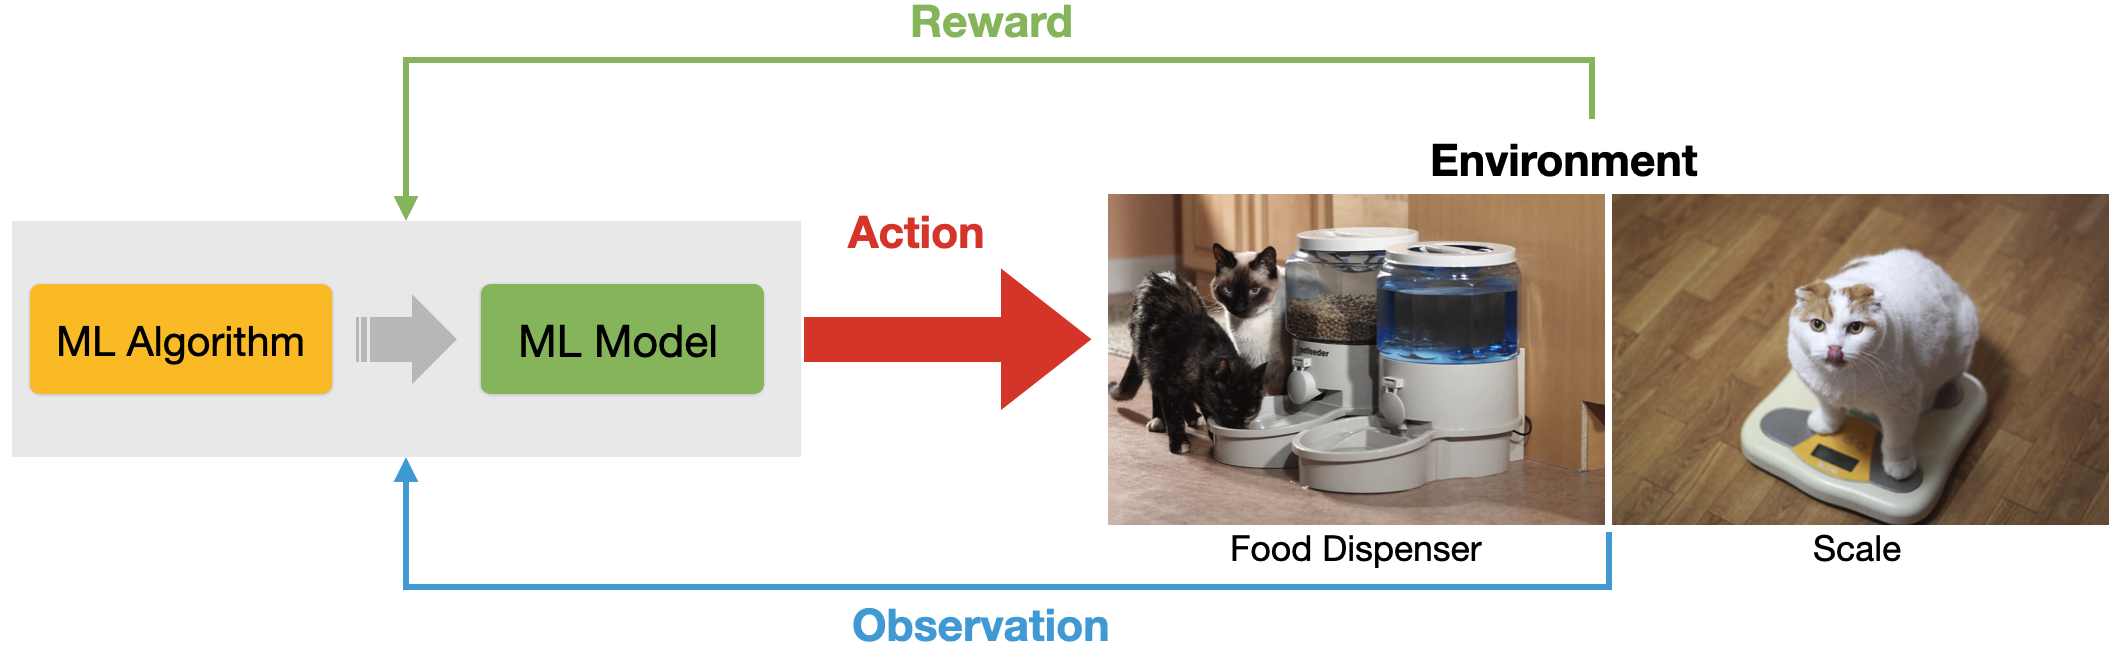
Reinforcement Learning
Data about the environment and reward function as input
The machine can perform actions influencing the environment
The machine learns behaviours that result in greater reward
Don’t forget domain expertise
- ML makes some tasks automatic, but we still need our brains
- More in Module 3 and Module 4
- Defining the prediction task
- Define the evaluation metrics
- Designing features
- Designing inclusions and exclusion criteria for the data
- Annotating (hand-labeling) training (and testing) data
- Select right model
- Error analysis
Machine Learning for Design
Lecture 2
Introduction to Machine Learning. Part 2